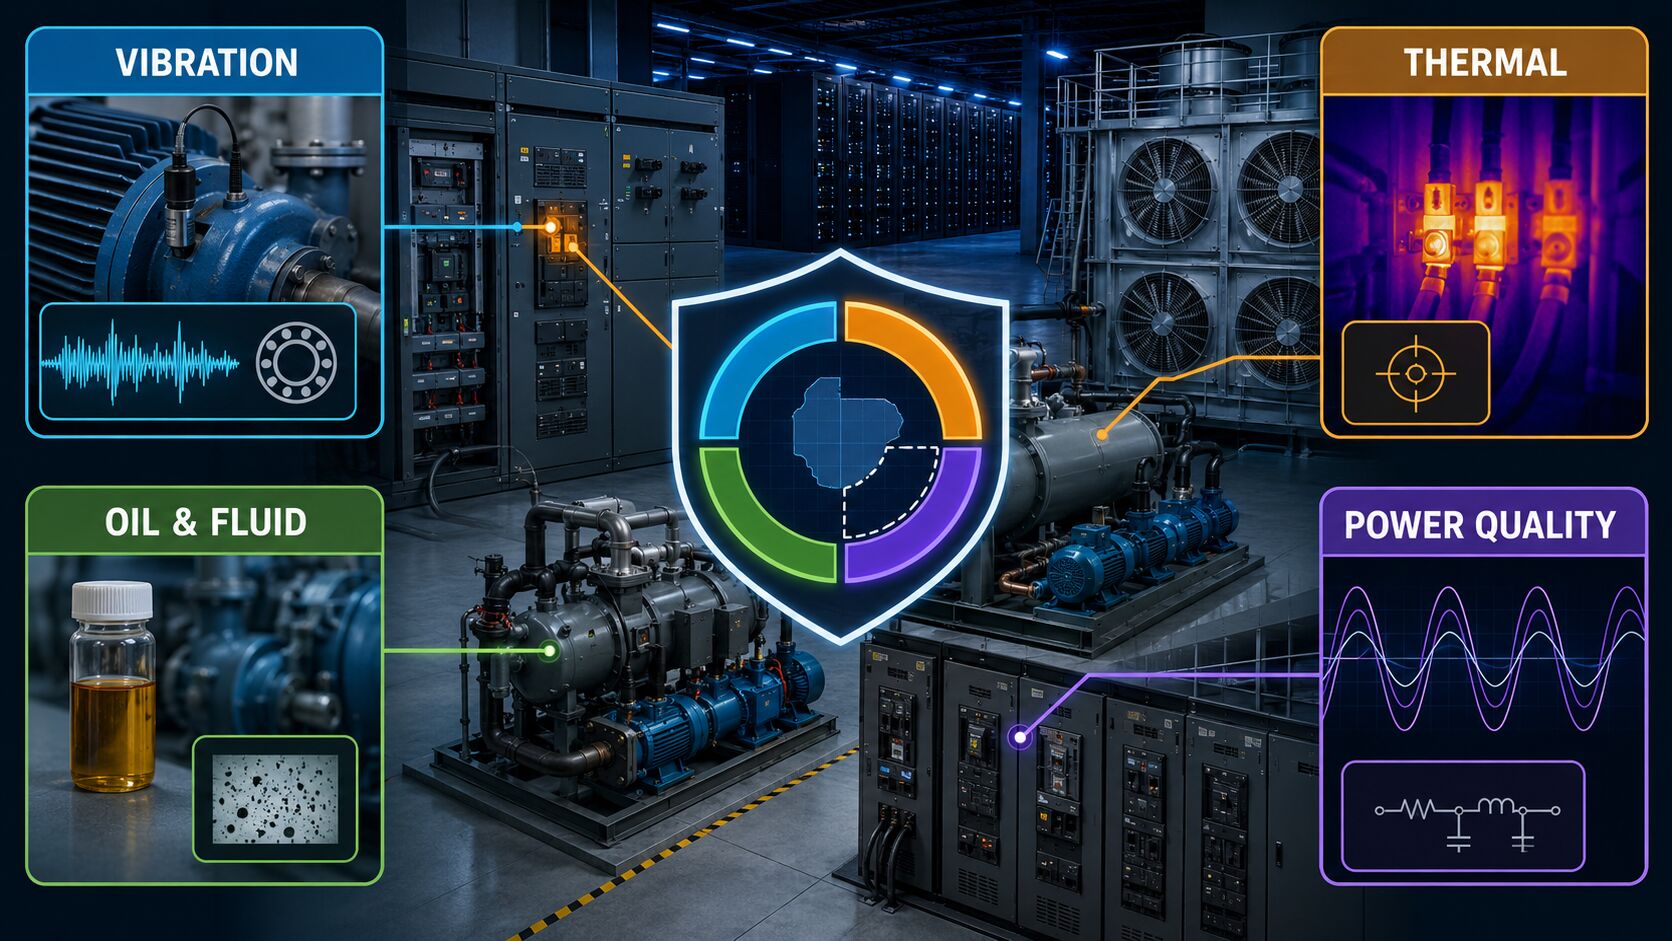
Vibration, thermal, oil analysis, and power quality sensors each answer a different failure question — skipping one leaves a blind spot.
“Predictive” is a claim about coverage, not just technology
It’s easy to install one sensor type across a facility, point to the dashboard, and call the program predictive. The gap shows up later, when a failure occurs in a mode the sensor stack was never built to see. Predictive maintenance is a claim about failure-mode coverage across a system, not a claim about having sensors at all.
Each sensor category answers a narrow, specific question. None of them substitutes for another.
The four core sensor categories
Vibration analysis answers: is a rotating component (bearing, motor, fan, pump impeller) mechanically degrading? Vibration signatures shift well before a bearing seizes or a motor fails, and the frequency pattern often identifies which failure mode is developing — imbalance, misalignment, bearing wear, or looseness. This is the primary sensor category for chillers, pumps, cooling tower fans, and fan wall units.
Thermal imaging answers: is a connection, joint, or component running hotter than it should relative to its load? This is the sensor category that matters most for PDUs, transfer switches (TOU), and breaker panels, where the dominant failure mode is connection resistance building up at a joint — invisible electrically until the joint fails, but visible thermally well in advance.
Oil and fluid analysis answers: is the lubricant or working fluid itself degrading, and does that degradation indicate wear elsewhere in the system? Particle counts, moisture content, and acid number in chiller and pump lubricant reveal internal wear that neither vibration nor thermal sensors can see directly — the fluid is carrying evidence from inside the machine.
Power quality and electrical monitoring answers: is the electrical signature (harmonics, power factor, current imbalance, impedance) drifting in a way that indicates internal degradation? This is the category that makes UPS battery impedance trending possible, and it also catches motor winding degradation in pumps and fans before a mechanical symptom appears.
Mapping sensors to the systems in this series
| System | Primary sensor category | What it’s watching for |
|---|---|---|
| UPS & UPS batteries | Power quality / impedance | Cell degradation, internal resistance rise |
| Chillers & pumps | Vibration + oil analysis | Bearing wear, misalignment, refrigerant/lubricant condition |
| Cooling towers & fan wall units | Vibration + airflow/thermal | Fan bearing wear, airflow degradation, fill fouling |
| PDU & TOU | Thermal imaging | Connection resistance, hot joints |
A sensor stack that only covers one row of this table isn’t incomplete by accident — it usually reflects whichever monitoring technology was easiest to procure first, not the actual failure-mode coverage the facility needs.
Baseline before threshold
None of these sensors are useful without a documented baseline captured when the equipment was known-good. A vibration reading or a thermal image is only meaningful in comparison to what that same point on that same equipment looked like at commissioning or after the last major service. Skipping the baseline step means the program is left comparing current readings to generic industry thresholds instead of the equipment’s own history — which misses gradual drift that never crosses a generic alarm limit but is still a clear predictive signal against its own baseline.
Put this into practice: Download the AI Data Center Sensor Stack Coverage Template to map MEP failure modes to vibration, thermal, oil and fluid, and power-quality monitoring, record known-good baselines, identify coverage gaps, and track deployment through to CMMS work-order integration.
Where this leads
The next posts in this series apply this sensor framework system by system, starting with UPS and UPS batteries — what impedance trending actually predicts, and how far ahead of failure it gives you warning.

