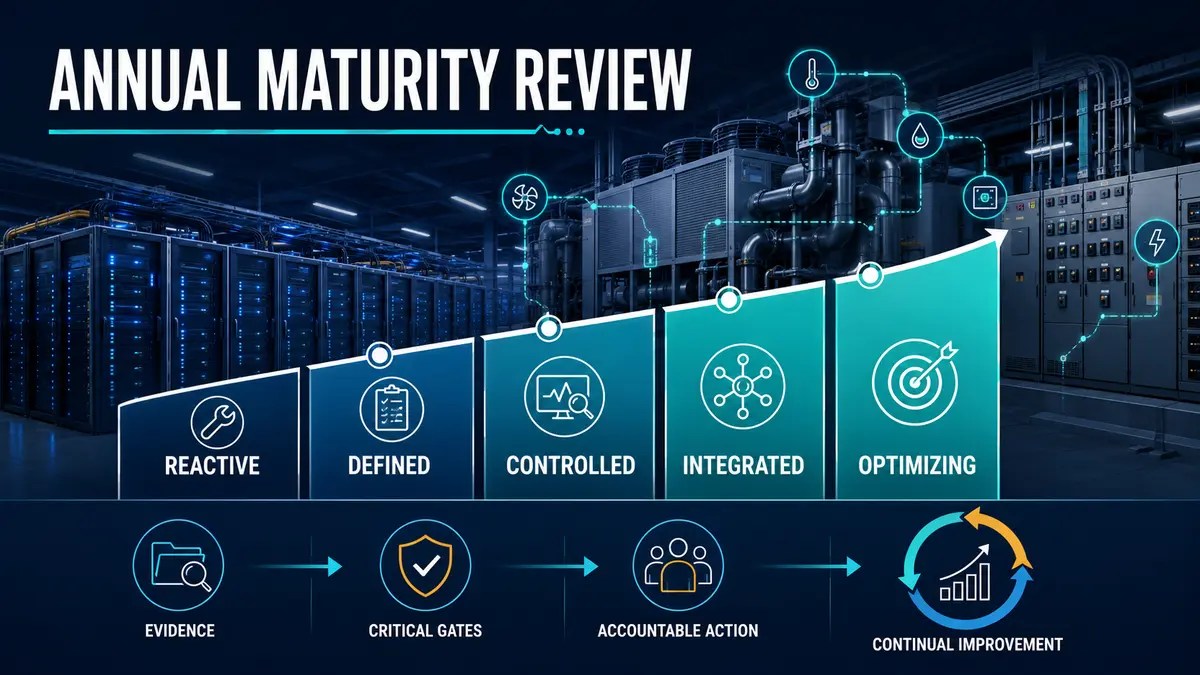
A predictive-maintenance program should not be judged by how many sensors were installed, how many dashboards were created or how many alerts were generated. It should be judged by whether the organization can repeatedly turn trustworthy condition evidence into safe, timely and verified maintenance decisions.
That capability changes over time. Staff rotate. Equipment ages. Models drift. Asset mappings change. Vendors update platforms. New sites join the portfolio. A control that passed during the pilot can quietly weaken during production.
An annual maturity assessment gives management and engineering teams a structured way to test whether the complete operating system still works—from asset strategy and sensor health to work-order execution, cybersecurity, verified outcomes and continual improvement.
Abbreviation reference
- BMS — Building Management System: Supervisory platform for building services such as cooling and environmental systems.
- EPMS — Electrical Power Monitoring System: Platform for electrical distribution, loading, power quality and related alarms.
- DCIM — Data Center Infrastructure Management: Software connecting facility, asset, capacity and service-dependency information.
- CMMS — Computerized Maintenance Management System: System for maintenance assets, work orders, job plans, labor, parts and history.
- OT — Operational Technology: Systems that monitor or control physical equipment and processes.
- KPI — Key Performance Indicator: A defined measure used to assess performance or control effectiveness.
- OEM — Original Equipment Manufacturer: The equipment manufacturer and source of product-specific requirements.
- RACI — Responsible, Accountable, Consulted and Informed: A method for assigning roles in a process or decision.
- SOP/MOP/EOP — Standard, Method of Procedure and Emergency Operating Procedure: Controlled instructions for normal, planned and emergency work.
This is a management assessment—not a certification claim
ISO 55001:2024 specifies requirements for establishing, implementing, maintaining and improving an asset-management system. ISO 17359:2018 provides general procedures for setting up a condition-monitoring program for machines. The U.S. Department of Energy describes effective operations and maintenance as an integrated program that balances reactive, preventive, predictive and reliability-centered approaches.
These sources support the management-system and condition-monitoring principles used in this assessment. They do not publish the five-level predictive-maintenance scale used here, and completing the workbook does not establish certification or conformity with any standard.
The maturity levels are an operational decision aid. Each organization should approve its criteria, evidence requirements, scoring rules and risk gates before using the result for investment, assurance or portfolio comparison.
Assess capability, not technology ownership
Buying a vibration platform does not prove that rotating-equipment degradation will be detected and acted upon. Connecting a battery monitor does not prove that cell drift will create a usable maintenance response. Integrating analytics with a Computerized Maintenance Management System (CMMS) does not prove that the resulting work order will contain enough evidence or that the original condition will be retested.
The assessment should therefore examine eight connected dimensions:
- Strategy and scope — Is predictive maintenance tied to asset criticality, failure consequences and business objectives?
- Asset and failure-mode coverage — Are assets, components, measurement points and warning signatures correctly mapped?
- Measurement and data trust — Are calibration, sensor health, timestamps, operating context, lineage and data quality controlled?
- Analytics and decision assurance — Are rules and models validated for their intended use, limitations and failure costs?
- Work management and verified closure — Do credible events become owned work with procedures, retesting and acceptance evidence?
- People and governance — Are decision rights, competence, escalation and change control clear?
- Cybersecurity and resilience — Are connected sensors, gateways, data flows, remote access and recovery protected?
- Performance and continual improvement — Are outcomes measured, lessons converted into controlled changes and value claims supported?
A high score in analytics cannot compensate for weak work-order execution. A strong sensor-health process cannot compensate for unmanaged remote access. Maturity belongs to the complete control loop.
Use five levels with observable evidence
Level 1 — Reactive
Activity is mainly event-driven and dependent on individuals. Sensors or dashboards may exist, but scope, ownership and evidence requirements are inconsistent. Alerts often require manual reconstruction before anyone can decide what to do.
Typical evidence:
- Isolated monitoring tools without an approved program charter
- Incomplete asset or measurement-point mapping
- Generic thresholds with little operating-context validation
- Informal escalation through chat or email
- Work closed without comparable retesting
- Benefits described through anecdotes rather than traceable cases
Level 2 — Defined
The organization has documented processes, named owners and a bounded asset scope. Baseline, validation, work-order and closure requirements are defined, but implementation is uneven or still relies heavily on manual control.
Typical evidence:
- Approved pilot or program scope
- Asset and failure-mode register
- RACI and escalation matrix
- Data-quality and calibration rules
- Standard work-order fields and retest expectations
- Initial KPIs with documented definitions
Level 3 — Controlled
The process operates consistently on the approved scope. Data quality is monitored, event validation is repeatable, alarm noise is controlled, work is routed through the CMMS and closure requires evidence.
Typical evidence:
- Tested suppression, persistence and deduplication rules
- Traceable baseline and threshold approvals
- Sensor-health and clock-offset monitoring
- Work orders linked to source evidence
- Retest results and acceptance criteria recorded
- Periodic rule, access and performance reviews
Level 4 — Integrated
Predictive maintenance is integrated with asset strategy, Building Management System (BMS), Electrical Power Monitoring System (EPMS), Data Center Infrastructure Management (DCIM), CMMS, cybersecurity, financial review and site governance. Decisions consider service consequence, redundancy and operating context.
Typical evidence:
- Asset-to-service dependencies used in prioritization
- Common portfolio taxonomy with approved local extensions
- Model and rule release gates
- Supplier and remote-access controls integrated with work management
- Comparable KPI reporting across sites and equipment classes
- Finance-verified realized benefits separated from avoided-risk scenarios
Level 5 — Optimizing
The program uses verified outcomes to improve rules, procedures, training, sensor coverage and investment choices. Cross-site learning is controlled, performance is compared fairly and the organization can adapt without weakening safety or accountability.
Typical evidence:
- Closed-loop analysis of false positives, missed detections and repeat alerts
- Controlled transfer of validated lessons across sites
- Trend-based maturity targets and investment decisions
- Independent challenge of models, benefit claims and evidence quality
- Retirement of low-value rules and scaling of proven use cases
- Demonstrated recovery exercises and continuous improvement actions
Level 5 does not mean perfect automation. It means the organization can learn and adapt while preserving human authority over high-consequence maintenance decisions.
Score evidence before scoring maturity
Self-assessments become unreliable when respondents score intent instead of implementation. A policy draft should not receive the same credit as an approved process demonstrated through current records.
Each criterion should record both:
- Implementation score: How consistently is the control operating?
- Evidence strength: How reliable, current and representative is the proof?
A practical evidence scale is:
- 0 — None: No evidence supplied.
- 1 — Stated: Interview or narrative evidence only.
- 2 — Documented: Approved process, register or configuration exists.
- 3 — Demonstrated: Current operating records show the control working across the assessed scope.
The workbook uses evidence strength to adjust the raw maturity result. This prevents a well-written procedure with no operating records from appearing equal to a demonstrated control.
Do not let averages hide critical gaps
An overall average is useful for trend reporting, but it must not override mandatory safety, integrity or accountability controls.
Critical gates should include requirements such as:
- High-consequence work requires corroborating evidence and human approval.
- Critical assets and measurement points have accountable owners.
- Sensor quality and timestamp integrity are checked before action.
- Remote access is controlled, time-bound and reviewable.
- Completed work is retested against the original condition.
- Material model, rule and baseline changes are approved and traceable.
- High-risk findings have assigned actions and due dates.
If a critical gate fails, the assessment should hold the program at its current level even when the weighted average suggests advancement.
Assess by sampling real cases
Interviews and procedures are necessary, but the strongest evidence comes from tracing complete operating cases.
Sample a balanced set that includes:
- A validated condition that became planned maintenance
- A high-consequence event that required operational escalation
- A false positive or invalid-data event
- A repeated alert after corrective work
- A suppressed event during approved maintenance
- A rule or model change
- A vendor remote-access session
- A cybersecurity or data-integrity incident exercise
- A claimed realized saving or avoided-risk scenario
- A retired monitoring rule or deferred investment decision
For each case, trace the chain from original measurement through validation, prioritization, work, retest, closure, learning and financial classification. A process that works only in presentations is not mature.
Run the assessment as an annual control cycle
1. Set the scope
Define included sites, systems, asset classes, platforms, vendors and assessment period. Record material exclusions and why they were excluded.
2. Confirm assessors and independence
Use a cross-functional team covering operations, maintenance, reliability, controls, data, cybersecurity and finance. The owner of a control can provide evidence, but material conclusions should receive independent challenge.
3. Freeze the scoring rules
Approve criteria, weights, evidence rules, critical gates and maturity thresholds before reviewing results. Changing the scoring model after seeing the score undermines comparability.
4. Collect and sample evidence
Use current records from the assessed period. Record source, owner, date, scope, sample size and limitations. Do not accept screenshots without enough context to establish origin and time.
5. Calibrate ratings
Assessors should compare difficult or borderline criteria together. The purpose is consistent interpretation—not negotiating a higher score.
6. Approve gaps and actions
Every material gap should have a risk statement, action, accountable owner, due date, required evidence and acceptance authority.
7. Set a target state
The target should reflect risk and operating need. Not every dimension must reach Level 5. A stable Level 3 control may be sufficient for a low-consequence asset class, while a protected AI load path may justify Level 4 integration and stronger evidence.
8. Review progress quarterly
The maturity assessment is annual, but corrective actions should not wait a year. Review overdue high-risk actions, failed gates, deteriorating KPIs and major program changes quarterly.
Compare sites carefully
Portfolio reporting should show where support or control improvement is required, not create a simplistic league table.
Before comparing sites:
- Use the same criterion definitions and evidence scale.
- Preserve local operating context and approved deviations.
- Compare equivalent asset classes and monitoring scope.
- Normalize volume-based KPIs where necessary.
- Separate missing evidence from genuinely weak performance.
- Record changes to the scoring model between years.
- Explain material changes in scope, staffing, technology or risk.
A site may score lower because it supplied honest evidence and identified gaps, while another site appears stronger because its assessment was superficial. Independent calibration matters.
Measure improvement, not score movement alone
Useful annual outcome measures include:
- Percentage of critical criteria with demonstrated evidence
- Failed critical gates and time to closure
- High-risk actions overdue
- Data availability and sensor-health performance
- Actionable-alert and false-positive rates
- Detection-to-validation and validation-to-assignment time
- Work orders with complete evidence
- Completed work with comparable retesting
- Repeat-alert rate after intervention
- Planned versus emergency interventions
- Verified realized benefits
- Confidence-adjusted avoided-risk scenarios
- Rules scaled, redesigned or retired after review
A higher maturity score without better operating evidence is not improvement. The objective is safer and more reliable decisions.
Put this into practice
Use the AI Data Center Annual Predictive-Maintenance Maturity Assessment Workbook to score eight capability dimensions, record evidence strength, test critical gates, compare current and target states, manage corrective actions, track annual and quarterly reviews, and present an executive dashboard without allowing averages to conceal material gaps.
Download the Excel Maturity-Assessment Workbook
A biblical perspective on knowing the condition
“Be sure you know the condition of your flocks, give careful attention to your herds.”
— Proverbs 27:23 (NIV)
Responsible stewardship begins with knowing the true condition of what has been entrusted to us. That requires more than collecting information. It requires attention, verification and a willingness to act on what the evidence reveals.
An annual maturity assessment applies the same principle to the maintenance program itself. The organization should know whether its controls are functioning, whether people have clear responsibility, whether decisions are supported by trustworthy evidence and whether identified weaknesses are being corrected. Honest assessment is not criticism of the program; it is how the program remains worthy of trust.
The annual standard
A predictive-maintenance program is mature when it can repeatedly demonstrate that credible condition evidence reaches the right decision-maker, produces safe and accountable work, closes through comparable retesting, survives change and uses verified outcomes to improve the next decision.
The annual review should answer one practical question:
Can the organization prove that its predictive-maintenance control loop still works under current people, assets, systems, suppliers and operating risks?
If the answer is incomplete, the assessment has done its job. It has made the next improvement visible.
Research references
- ISO 55001:2024 — Asset management system requirements
- ISO 17359:2018 — Condition monitoring and diagnostics of machines: General guidelines
- U.S. Department of Energy — Operations and Maintenance Challenges and Solutions
- NIST Cybersecurity Framework 2.0
- Institute of Asset Management — Excellence and Maturity

