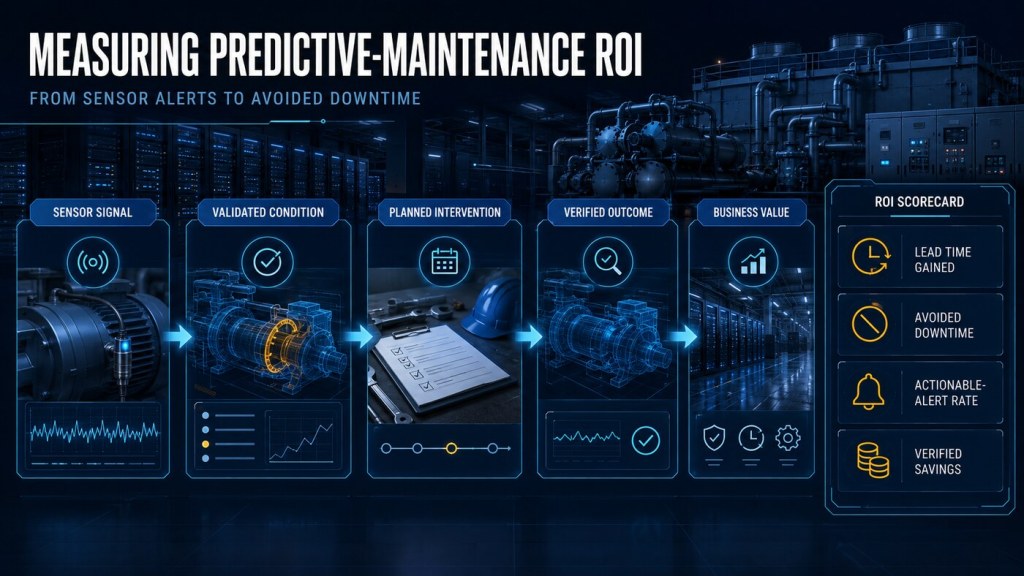
Predictive-maintenance ROI is credible only when the evidence chain runs from a detected condition to a verified intervention and then to a financial classification that distinguishes realized savings from reduced risk exposure.
The dashboard is not the return
A facility can install vibration sensors, thermal monitoring, battery impedance tools and analytics software without creating measurable value. Sensors create observations. Value appears only when a credible observation is validated, converted into planned work, completed before service impact, retested against the original evidence and linked to an approved cost or risk model.
This distinction matters in AI hyperscale data centers because the potential consequences are large while the counterfactual is difficult to prove. If a hot PDU joint is repaired before it fails, the team can verify the condition and the repair. It cannot claim with certainty that a full outage would have occurred the following week. The business case must therefore separate what was actually saved from what risk was credibly reduced.
Start with one auditable intervention case
Every claimed benefit should begin with a complete intervention record containing:
- the asset, component and failure mode;
- the known-good baseline and operating context;
- the condition evidence and rate of change;
- the validation decision and confidence level;
- the CMMS work order, labor, parts and intervention date;
- the retest result against the original condition evidence;
- the actual service impact, if any; and
- the approved financial classification and evidence reference.
This structure is consistent with the logic behind ISO 17359:2018, which provides general procedures for establishing a condition-monitoring program, and with the standardized reliability and maintenance data principles described by ISO 14224:2016. ISO 14224 is written for petroleum and natural-gas operations, so its equipment taxonomy is not a data-center specification; its disciplined approach to equipment, failure and maintenance records is still a useful model when adapted to MEP assets.
Separate realized savings from avoided risk
Realized savings
Realized savings are traceable cost differences supported by actual records. Examples include lower contractor callout cost because work was planned, reduced overtime, avoided expedited freight, lower parts consumption against an approved baseline or a verified reduction in service-impact cost compared with a genuinely comparable event.
A simple attributed-saving calculation is:
Attributed realized saving = (approved baseline cost − actual cost) × attribution factor
The attribution factor matters because predictive maintenance may not be the only cause. A vendor contract change, spare-parts improvement, staffing change or equipment upgrade may have contributed. Finance should approve both the baseline and the attribution treatment.
Avoided-risk exposure
When the predicted failure did not occur, the value is normally a counterfactual risk estimate rather than realized cash. A transparent screening model is:
Adjusted exposure reduction = (pre-intervention probability − post-intervention probability) × consequence × attribution factor × confidence factor
Use low, base and high consequence scenarios. Document how probabilities were estimated, what redundancy was available, which service was exposed and who approved the model. Report the result as confidence-adjusted avoided-risk exposure—not guaranteed downtime savings.
Avoid the five common ROI overclaims
- Valuing every alert as an avoided failure. An alert has no financial value until it becomes a validated case with an accountable decision.
- Using full replacement cost as a saving. A replacement that was deferred may represent timing or cash-flow value, not permanent cost elimination.
- Adding avoided-risk scenarios to realized cash. Present the two views side by side unless Finance and Risk approve a combined methodology.
- Ignoring program operating cost. Sensors, gateways, licenses, integration, calibration, cybersecurity, data engineering, training, analyst time and governance all belong in the denominator.
- Claiming closure without retesting. A closed work order proves that work was recorded; a retest proves whether the original condition improved.
Measure the operating mechanisms before the money
Financial outcomes are often lagging indicators. During the early months, management should also track whether the operating control loop is improving:
- Actionable-alert rate: validated events that required action divided by alerts reviewed.
- Lead time gained: time between validated detection and the point at which failure or service impact would otherwise become likely, stated as an engineering estimate with its basis.
- Planned-intervention ratio: planned interventions divided by planned plus emergency interventions.
- Detection-to-validation time: how quickly raw evidence becomes an owned decision.
- Validation-to-assignment time: how quickly credible conditions enter the work-management process.
- Verified-closure rate: interventions closed with acceptable retest evidence divided by interventions completed.
- Repeat-alert rate: recurring alerts after intervention, which may indicate incomplete repair, a poor rule or an unchanged failure driver.
- False-positive cost: labor and disruption spent investigating invalid or non-actionable events.
U.S. Department of Energy guidance on maintaining pumping systems describes predictive maintenance in terms of tests and inspections that detect deteriorating conditions. The Department’s maintenance-history guidance also emphasizes retrievable information for trending, problem analysis and knowledge-based decisions. That evidence discipline is essential to any defensible ROI claim.
Build the management view in two columns
A useful executive dashboard should never hide the classification boundary.
Financial view
- approved program cost;
- finance-verified attributed savings;
- net realized benefit;
- realized ROI;
- benefit-to-cost ratio; and
- simple payback as a screening metric.
Risk view
- approved scenario count;
- low, base and high exposure reduction;
- confidence and attribution factors;
- redundancy and affected-service context; and
- assumptions requiring revalidation.
The executive decision is then clearer: Is the program producing verified operational improvement? Are realized benefits beginning to cover cost? Is the risk reduction credible enough to justify continued investment? Which rules should scale, be redesigned or be retired?
Download the predictive-maintenance ROI calculator
Use the Excel workbook to record program costs, intervention cases, finance-verified savings, low/base/high avoided-risk scenarios, operational KPIs, sources and assumptions. The dashboard keeps realized ROI separate from confidence-adjusted risk exposure.
A biblical perspective on counting the cost
“Won’t you first sit down and estimate the cost?”
Luke 14:28 (NIV)
Jesus used the picture of a builder counting the cost to teach the seriousness of commitment and completion. Applied carefully to operational stewardship, the principle reminds us not to begin an impressive program without understanding its resources, responsibilities and path to completion. Measuring predictive-maintenance ROI is therefore not merely a finance exercise. It is a discipline of honest planning: count the full cost, verify the evidence and do not claim what the record cannot support.
The standard for a credible return
A predictive-maintenance program proves value when it repeatedly turns credible condition evidence into planned, verified intervention—and when the resulting benefit is classified honestly. Realized savings should be supported by actual records. Avoided downtime should be reported as a transparent, confidence-adjusted risk scenario unless stronger evidence exists. Program cost should be complete, and every material assumption should remain visible for review.
The objective is not to produce the largest ROI number. It is to produce a decision-quality record that operations, engineering, Finance and Risk can all defend.

