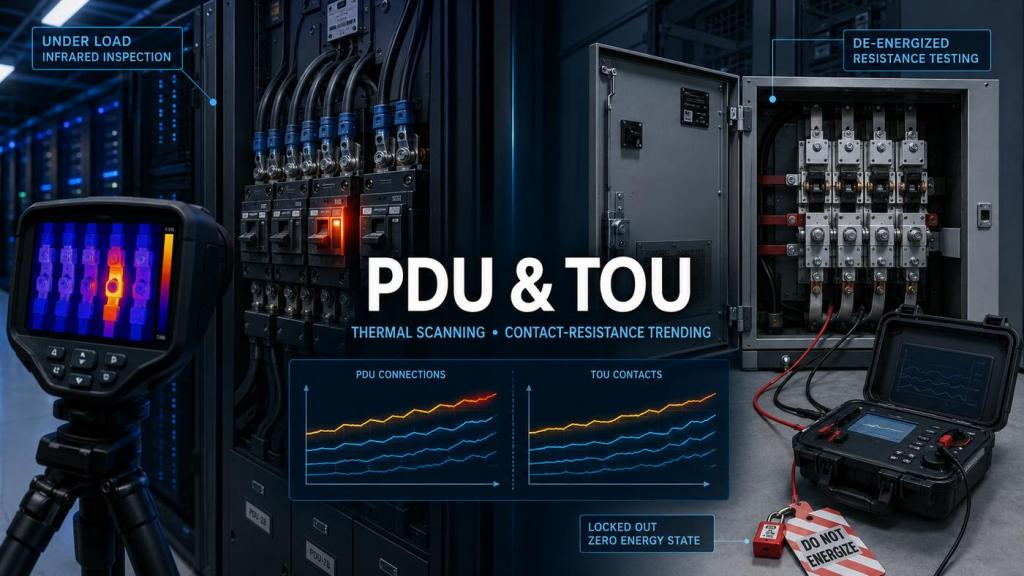
Thermal scanning and contact-resistance trending on power distribution gear catches the failure mode that actually causes outages: connection degradation, not component failure.
The failure mode that doesn’t show up on a load reading
Power distribution units (PDUs) and transfer/tie switches (TOU) rarely fail because a breaker or switch component wears out internally. They fail because a connection — a lug, a bus bar joint, a breaker terminal — degrades over time and eventually can’t carry its rated current without excessive heat. This is a mechanical and electrochemical problem, not an electrical-load problem, which is exactly why standard load monitoring misses it: a connection can be failing thermally while the current flowing through it stays completely within spec.
Connection degradation has a few common root causes: thermal cycling loosening a mechanical joint over repeated expansion and contraction, oxidation building up resistance at the contact surface, or a joint that was simply under-torqued during installation and has been degrading since day one. All three produce the same signature — rising resistance at that specific point — well before the connection fails outright.
Thermal imaging: the primary detection method
Infrared thermal imaging of PDUs, breaker panels, and transfer switches under load is the most direct way to catch this failure mode, because rising resistance at a connection shows up as a hot spot relative to the rest of the circuit long before it causes a trip or a failure. A few things matter for this to work as a predictive tool rather than a one-time inspection:
- Imaging under representative load. A connection with elevated resistance may not show a meaningful temperature differential at low load — the hot spot becomes visible as current (and therefore I²R heating) increases, so imaging during peak or near-peak load periods is more diagnostic than imaging during idle periods.
- Comparing against sibling connections, not just absolute temperature. A connection running warm in isolation is less informative than a connection running measurably warmer than an identical connection carrying similar load elsewhere on the same panel — the comparative reading controls for ambient conditions and load variation.
- Trending over successive scans, not just flagging a single hot reading. A connection that’s 3°C above its neighbors today and 8°C above them at the next scan is degrading at a rate that can be scheduled around; a connection that’s been stable at a small differential for years is a different risk profile entirely.
Contact-resistance testing as the complementary measurement
Where thermal imaging is a non-contact, under-load method, contact-resistance testing (micro-ohmmeter testing) provides a direct, quantitative measurement of connection resistance during scheduled maintenance windows when equipment can be taken offline or de-energized. This is particularly useful for transfer and tie switches, which — like the UPS static bypass switch covered earlier in this series — may sit in one position for long periods and only get exercised during an actual transfer event or a scheduled test.
Resistance readings trended over successive maintenance cycles catch gradual degradation the same way impedance trending does for UPS batteries: the absolute value matters less than the rate of change, and a joint whose resistance is climbing steadily warrants intervention even if it hasn’t yet crossed a generic threshold.
Why TOU switches need both methods
Transfer and tie switches carry a specific risk that straight PDU distribution doesn’t: the contacts that matter most are the ones in the position the switch isn’t currently sitting in. A switch normally in the “normal” position has its “alternate” side contacts un-loaded and un-monitored by thermal imaging under normal operation, which is exactly why scheduled contact-resistance testing — de-energized, direct measurement — is necessary as a complement to thermal scanning rather than a redundant backup to it.
Put this into practice
Download the AI Hyperscale PDU and TOU Thermal and Contact-Resistance Trending Template to register every critical joint and switch path, document representative-load thermal scans, compare sibling connections, trend de-energized resistance tests, prove normal and alternate transfer paths, assign corrective work, and verify closure through retesting.
A biblical perspective on diligent maintenance
“The plans of the diligent lead to profit as surely as haste leads to poverty.”
Proverbs 21:5 (NIV)
Predictive electrical maintenance reflects disciplined stewardship. Diligence means inspecting connections under representative conditions, comparing reliable evidence, tracking deterioration over time, and planning corrective work before urgency forces a rushed response. Thermal and contact-resistance trending turn that principle into an actionable maintenance discipline.
Closing out the series
This closes the system-by-system breakdown that started with UPS and batteries and worked through chillers, pumps, cooling towers, and fan wall units. The pattern has held across every system: the failure modes that actually cause incidents are rarely visible in standard operational readings, and the sensor categories covered in this series — impedance, vibration, thermal, oil analysis, and contact resistance — exist specifically to surface them while there’s still time to schedule the fix instead of reacting to it.
The next posts in this content plan move from system-level monitoring to program-level execution: how sensor data actually routes into CMMS and DCIM systems as work orders, and how to measure the ROI of a predictive maintenance program once it’s running.

