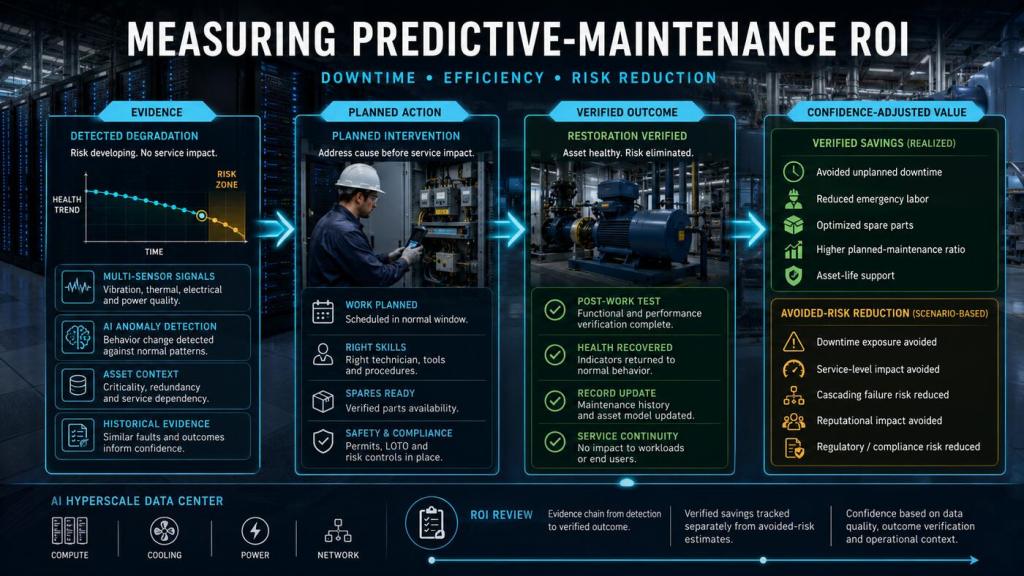
Predictive-maintenance ROI is credible only when verified savings are separated from scenario-based avoided risk, and every benefit can be traced back to an intervention and its evidence.
The problem with “we prevented an outage”
The easiest way to make predictive maintenance look financially attractive is to assign the full cost of a hypothetical outage to every early warning that resulted in maintenance. It is also the fastest way to lose credibility with finance, engineering and operations leaders.
A degrading bearing, battery cell or electrical connection may have progressed to failure if left unattended. It may also have remained operational until the next planned service window. Because the failure did not occur, the exact counterfactual cannot be observed. That does not make the intervention valueless, but it means the benefit must be classified honestly.
A useful ROI model therefore separates two questions:
- What cost or saving was actually realized and can be verified?
- What operational risk exposure was plausibly reduced, and with what level of confidence?
Keeping those questions separate produces a more conservative headline, but a much stronger investment case.
Start with the complete cost of the program
Predictive-maintenance costs extend beyond the sensors mounted on equipment. A proper cost baseline should include:
- Sensors, gateways and specialist test equipment
- Monitoring and analytics software
- BMS, EPMS, DCIM and CMMS integration
- Installation, commissioning and baseline capture
- Reliability-engineering and analyst labor
- Vendor support and laboratory services
- Training, procedure development and governance
- Sensor calibration, replacement and data-quality maintenance
- False-positive investigation and non-actionable work
One-time capital costs and recurring operating costs should be reported separately. A pilot may carry significant first-year integration expense while producing only a small number of verified interventions. That can create a negative early financial ROI even when the program is operating as designed. Hiding that result behind large avoided-outage claims prevents management from seeing the real maturity curve.
Measure realized savings first
Realized savings are the strongest part of the ROI case because they are tied to observable costs. Examples include:
- Reduced emergency labor: planned work completed during a normal maintenance window instead of an after-hours response.
- Reduced contractor premiums: scheduled vendor attendance replacing urgent mobilization.
- Reduced expedited freight: parts ordered through normal procurement instead of emergency shipping.
- Reduced secondary damage: a degrading component repaired before it damaged adjacent equipment, where the avoided repair scope is supported by comparable history.
- Optimized parts replacement: condition evidence preventing premature replacement while remaining within an approved engineering and OEM framework.
- Reduced repeat work: verified diagnosis and retesting preventing repeated troubleshooting visits.
Each saving should have a baseline source, actual cost, evidence reference and finance review. If a process improvement, vendor contract change or staffing adjustment also contributed, an attribution factor should be applied rather than assigning the entire saving to predictive maintenance.
Treat avoided downtime as risk reduction
Avoided downtime often represents the largest potential value in an AI hyperscale facility, but it is normally a scenario rather than realized cash. The calculation should therefore be framed as confidence-adjusted exposure reduction.
A practical structure is:
Adjusted avoided-risk value = probability reduction × consequence × attribution × confidence
Each term needs an evidence basis:
- Pre-intervention probability: the estimated likelihood of the defined failure scenario before corrective work.
- Post-intervention probability: the remaining likelihood after repair and verified restoration.
- Consequence: the approved low, base and high impact of that scenario, including repair, service and contractual exposure where applicable.
- Attribution: the portion of the exposure reduction reasonably credited to the predictive intervention.
- Confidence: the strength of the condition evidence, historical basis, outcome verification and operational context.
The result should be shown as a range—not a guaranteed saving. A low, base and high consequence view makes uncertainty visible and prevents one dramatic number from dominating the investment discussion.
Build one evidence chain per intervention
The unit of evidence is not the sensor or the alert. It is the complete intervention case:
- A condition deviated from its known-good baseline.
- The finding was validated against load, operating state and corroborating evidence.
- A planned work order was created with a clear owner and procedure.
- The work was completed before service impact.
- The original condition was retested under comparable conditions.
- The outcome met the approved acceptance criterion.
- The financial result was classified as realized saving, avoided-risk scenario or no recognized benefit.
This structure prevents the program from claiming value for alerts that never produced an intervention, work that was not verified or conditions that were later found to be sensor or diagnostic errors.
Operational metrics explain the financial result
Financial ROI is a lagging indicator. Management also needs operational measures that show whether the mechanism expected to create value is improving.
Useful leading indicators include:
- Planned versus emergency maintenance ratio
- Detection-to-validation and validation-to-action time
- Percentage of completed interventions with retest evidence
- Repeat-alert rate after corrective work
- Emergency labor hours
- Parts-expedite and urgent-vendor costs
- False-positive investigation cost
- Condition findings resolved before service impact
- Time critical assets spend in an elevated-risk state
If the planned-maintenance ratio improves, emergency hours fall and verified closure increases, the program may be creating operational value before the first-year financial ROI turns positive. Conversely, a dashboard full of alerts with rising false-positive cost is evidence that the program needs correction, regardless of how many sensors have been installed.
Asset-life extension needs disciplined treatment
Predictive maintenance can support longer asset life by preventing operation in a degraded state and avoiding unnecessary calendar-based replacement. But the entire replacement value should not be recognized as an immediate saving.
A defensible asset-life benefit requires engineering approval that replacement or overhaul can be deferred, an updated condition assessment, a revised lifecycle date and finance treatment of the timing difference. The value is usually the approved cash-flow or depreciation effect of the deferral—not the full cost of the asset.
What an executive ROI review should ask
- Which benefits are realized and finance-verified?
- Which benefits are scenario-based exposure reductions?
- Are baselines comparable and traceable?
- Are attribution and confidence factors approved?
- Are low, base and high scenarios materially different?
- Were repairs retested before value was recognized?
- Is program cost falling or rising as coverage expands?
- Which rules create costly false positives?
- Which avoided-risk assumptions need revalidation?
The goal is not to make every period look positive. The goal is to understand whether the program is moving maintenance work from emergency response toward evidence-based planning while reducing credible operational exposure.
Put this into practice
Download the AI Hyperscale Predictive-Maintenance ROI Template to capture full program costs, build evidence-linked intervention cases, verify realized labor and parts savings, model low/base/high avoided-risk scenarios, apply attribution and confidence factors, track operational KPIs, and present an auditable executive dashboard.
A biblical perspective on counting the cost
“Won’t you first sit down and estimate the cost to see if you have enough money to complete it?”
Luke 14:28 (NIV)
Responsible stewardship requires more than claiming that technology creates value. It requires understanding the cost, measuring credible benefits and deciding whether the program can be sustained. Predictive-maintenance ROI should therefore be based on traceable evidence, transparent assumptions and confidence-adjusted outcomes—not exaggerated avoided-failure claims.
The throughline
A mature predictive-maintenance program does not promise that every alert prevented an outage. It proves that credible findings were validated, interventions were planned, repairs were verified and financial results were classified honestly.
Realized savings show what changed in the accounts. Confidence-adjusted avoided-risk scenarios show what exposure was plausibly reduced. Operational KPIs show whether the control loop is becoming faster, quieter and more reliable. Keeping those views connected—but not confused—is what turns predictive maintenance from a technology project into a defensible operating strategy.

